


CoreLogic’s new home price index showed that prices rose 7% in November over one year ago. It got us wondering how the housing market will shape up this year with the supply-demand equation still out of balance.
Rising prices are great news for sellers, including real estate investors interested in cashing in on home price appreciation. They are also good news for single-family residential investors with loans on properties as they will have stronger equity positions that frequently provide more favorable refinancing opportunities.
Certainly, rising home prices bring challenges as well. For investors looking to purchase single-family homes for long-term rentals or for fix-and-flip purposes, higher prices are a two-edged sword. While they can anticipate their investment gaining value, investors will also have to search harder to find deals that will be profitable.
That means being smart and well-informed. As always, real estate investors who know their markets well will be better situated for long-term success.
CoreLogic predicts that home prices for 2018 will rise 4.2% from November 2017 to November 2018 so the increases are expected to be slightly more tempered this year, although the hottest markets will almost certainly provide significantly better gains.
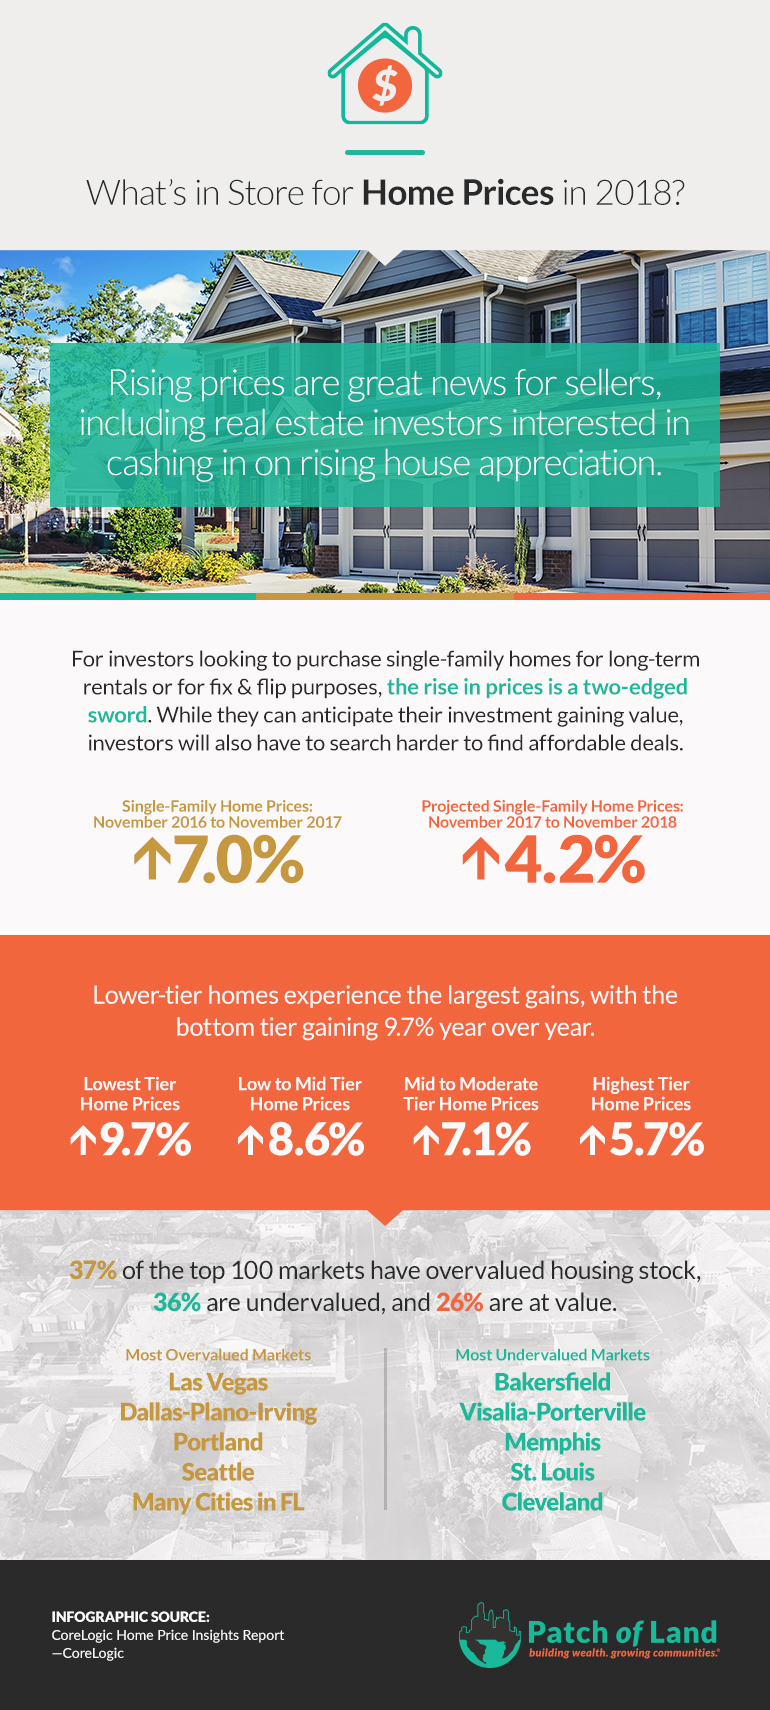
Lower-end homes experience largest gains
In its report, CoreLogic divides the nation’s housing stock into four groups where the lowest-priced tier of homes experienced the biggest gains, rising 9.7% year over year. The low- to middle-priced tier rose 8.6% and the middle- to moderate-priced tier was up 7.1%. The highest-priced tier rose 5.7%.
The four price tiers are based on the median sale price: homes priced at 75% or less of the median (low price), homes priced between 75 and 100% of the median (low-to-middle price), homes priced between 100 and 125% of the median (middle-to-moderate price) and homes priced greater than 125% of the median (high price).
The rise in low- and moderate-priced homes means homebuyers could get priced out of certain markets. Limited homes for-sale in these affordable tiers will mean continued higher rates of price growth for starter homes, according to Frank Nothaft, CoreLogic’s chief economist.
We believe this phenomenon, which may price some homebuyers out of the market, will keep the single-family rental market strong for the foreseeable future as saving for a down payment and affording higher monthly mortgage payments challenge low- to moderate-income balance sheets. A projected slight rise in mortgage interest rates this year may also play a role as it will have an effect on affordability.
CoreLogic’s report parses a wide range of data for the real estate investor. Its HPI provides measures for multiple market segments—what it calls tiers—based on property type, price, time between sales, loan type and distressed sales.
The report shows that 37% of the top 100 markets had overvalued housing stock, 36% were undervalued, and 26% were at value. Real estate investors can zero in on national maps to see where what cities are undervalued, at value or overvalued.
Las Vegas; Dallas-Plano-Irving; Portland; Seattle and many Florida cities are among the markets considered overvalued. Several central California cities such as Bakersfield, Visalia-Porterville, and Merced were considered undervalued as were many cities in the Midwest, South and Southeast, including Memphis, St. Louis and Cleveland.
Investors have a lot of information at their fingertips as they implement their 2018 investing goals during what looks to be another robust year for the housing market.


Jim commented January 27, 2018
I'm looking for a purchase loan for an existing multi-family unit in a growing area of California.
Please send me your pricing matrix showing: Max LTV, CS if any, rates, terms, costs and particulars of underwriting.
Thanks !!